Welcome to the SRCL Water Quality Page
Jamie Juelfs (JamieJuelfs@EdinaRealty.com) and Jon Folkedahl are the SRCLA Water Quality contacts.
Protecting and preserving the health of our lakes is vital to the beauty, recreation, and biodiversity of the SRCL. This page is your go-to resource for up-to-date information on water quality across the Sauk River Chain of Lakes. Here, you’ll find data on clarity, nutrient levels, invasive species, and more—along with insights into how you can help maintain and improve the health of our shared waters. Whether you’re a resident, visitor, or conservation partner, explore the tools and reports that keep our lakes clean and thriving for generations to come.
Want to make a difference? Learn how you can get involved in local water quality efforts and become a steward of the SRCL.
Here are two key areas we’ve been monitoring: Secchi Disk (water clarity) and Dissolved Oxygen.
Secchi Disk
When we are out on the lake we are constantly monitoring and evaluating the clarity of the water (whether we realize it or not)! That evaluation could come in the form of assessing the number of fish below our docks, or in how fast we need to swim to catch our kids’ goggles when they start sinking!
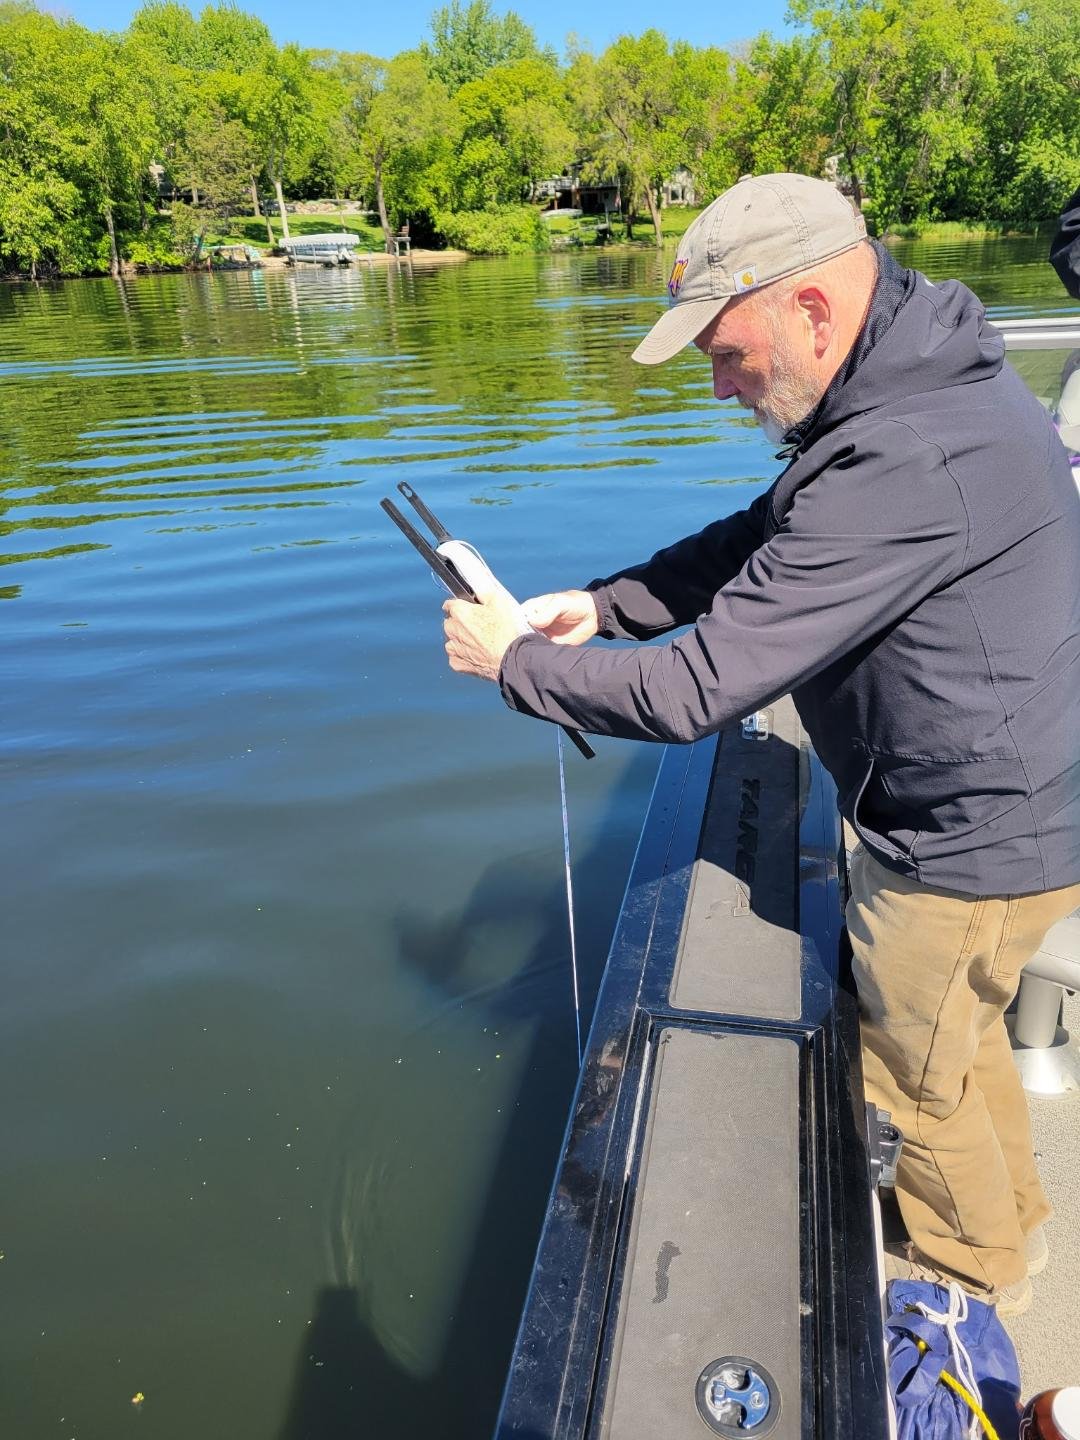
Scientifically, one of the simplest, yet most effective, ways to assess water clarity is by using a Secchi disk. This method relies on a black-and-white circular disk lowered into the water; the depth at which the disk is no longer visible—called the Secchi depth—indicates how clear the water is.
Higher Secchi readings (greater depth) indicate clearer water with fewer suspended particles.This is often a sign of good water quality.
Lower Secchi readings (shallower depth) can indicate higher levels of algae, sediment or other pollutants. This could be a result of runoff, erosion or excessive nutrient levels.
Click here to view the Year-over-Year Secchi Disk data (24-25).
Dissolved Oxygen
Dissolved oxygen (DO) is one of the most critical factors in determining the health of a lake’s ecosystem, particularly for fish and other aquatic life. It indicates the amount of oxygen that is available in the water for organisms to breathe. The concentration of dissolved oxygen is measured in milligrams per liter (mg/L) or as a percentage of saturation, with higher levels generally indicating a healthier aquatic environment. This measurement is not easily obtained without a special device that measures DO levels. The SRCLA is fortunate to have a device to help us understand what DO levels look like on the Chain.
High DO levels indicate a well-oxygenated lake that supports a diverse range of aquatic life.
Low DO levels can lead to fish kills and the growth of unwanted bacteria or algae, often due to excessive organic matter decomposing in the water.
DO levels fluctuate throughout the year and at different depths. Warmer temperatures in summer can lead to stratification, where the upper layers of water remain oxygen-rich while the lower layers become depleted. If the oxygen levels in deeper water drop too low, it can cause problems for fish and the overall ecosystem.
2025 DO Data: 05222025 Testing | 06262025 Testing | 07152025 Testing
-
Water Quality Scorecards
Scorecards for the SRWD here: https://srwdmn.org/monitoring/.
Statewide Scorecards: (https://lakes.rs.umn.edu/).
-
Previous Chain Link Articles
-
Water Quality Tips
-
How to Get Involved
Want an easy and fun way to contribute to the Chain’s Water Quality? Become a water monitoring volunteer through MN Pollution Control Agency. As of 7/14/25 volunteers were needed at East, Mud, Zumwalles, Bolfing, Little Cedar Island and Park.
OR consider joining the Water Quality team on the SRCLA!
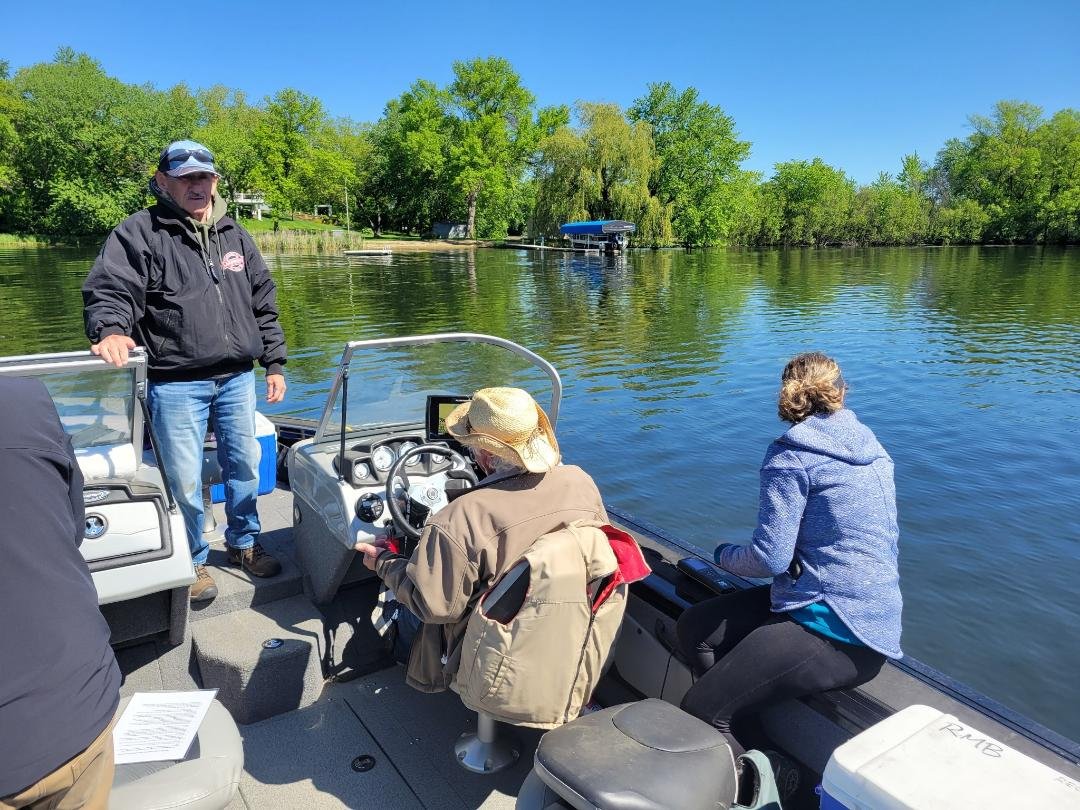
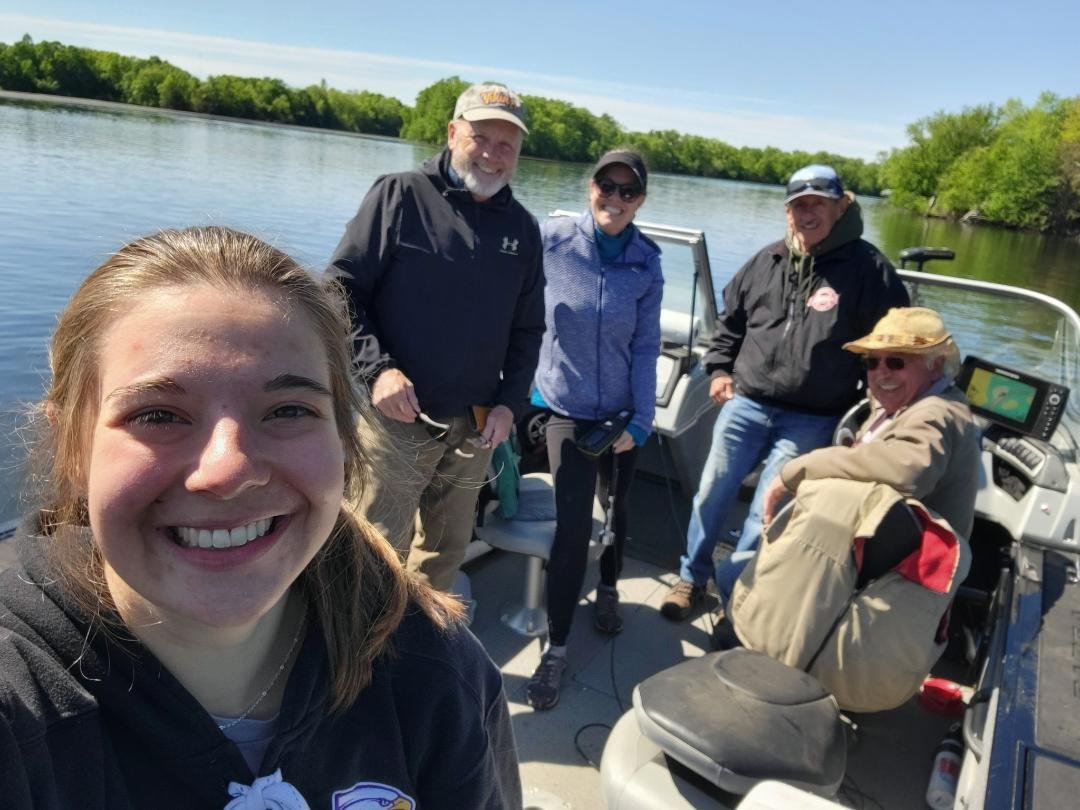

WQ Testing 6/26/25

WQ Testing 6/26/25

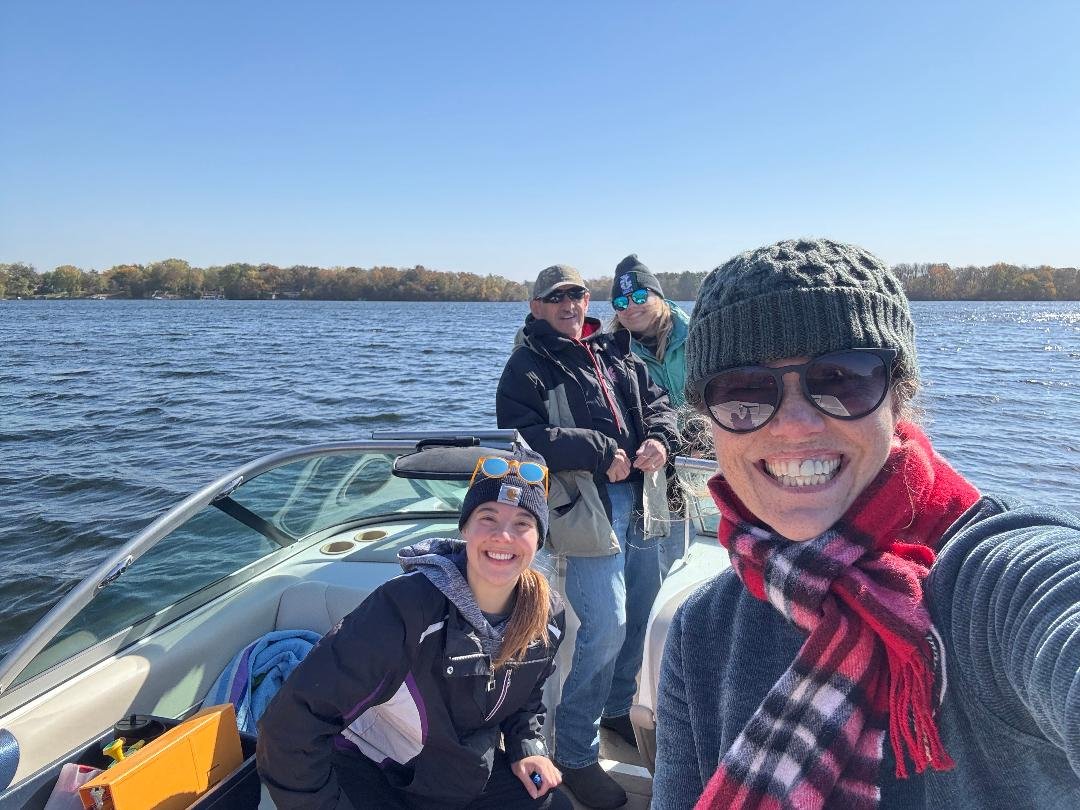
WQ Testing 6/26/25

WQ Testing 6/26/25

