Water Quality Monitoring Report - Fall ‘23
Gary Schnobrich, Water Quality Committee
Water quality monitoring for 2023 started in May and ends in September. Water samples were collected at six locations on the chain. Horseshoe, Cedar Island, Schneider, and Bolfing Lakes which are considered non-flowage bodies of water were sampled. Krays and Knaus Lakes, which are flowage lakes because the main channel of the Sauk River flows through the heart of them were also sampled. Water levels have dropped significantly over the course of the summer, and it will be interesting to see if that has had an impact on the data that was collected. At the conclusion of the season the Sauk River Watershed District will send us a report detailing the results of the 2023 monitoring season and compare it to previous years data to look for trends.
This year we have added a new set of parameters to our monitoring. The Association purchased a Digital Dissolved Oxygen and Temperature Meter that can determine the water temperature and amount of oxygen dissolved in the water column down to a depth of 20 meters (65 feet). At each of the six sampling locations we now record the temperature and dissolved oxygen (DO) at the surface and at one-meter intervals down to the lake bottom. This is called a lake depth profile. This temperature and oxygen information gives us an idea of the depth at which there is no longer enough dissolved oxygen to support fish and other aquatic organisms. The term “hypoxic zone,” also, often called the “dead zone,” begins when the dissolved oxygen in the water drops below two parts per thousand or two milligrams per liter (mg/l). Hypoxia is strongly linked to eutrophication in aquatic systems as the decomposition of large amounts of organic matter (i.e., from excessive aquatic plants and algal blooms) leads to oxygen depletion. This may help us understand how nutrients that have been deposited over decades in the lake bottom sediments are reintroduced into the water column again and contribute to aquatic plant growth and algal scum. Most lakes roll or turn over each fall as the seasonal cold air cools the oxygenated surface water. Colder water is denser and with the help of the wind sinks below the comparatively warmer, oxygen-depleted water from below which then comes to the surface. This can create a very stressful environment for fish and can move legacy nutrients like phosphorus upward in the water column. The Lilly Center for Lakes and Streams at Grace College in Indiana has created a web site which does a great job with visuals describing four ways turnover affects our lakes. It can be found at the following link. https://lakes.grace.edu/4-ways-to-describe-turnover-and-how-it-helps-our-lakes/. Their section titled “Beneath the Surface” is also very informative and applies to the Sauk River Chain of Lakes. If you enjoy ice fishing, click on the three bars in the upper right corner and go to “field notes.” Then scroll down until you find the article “What you should know about fish and their habitat during winter.”
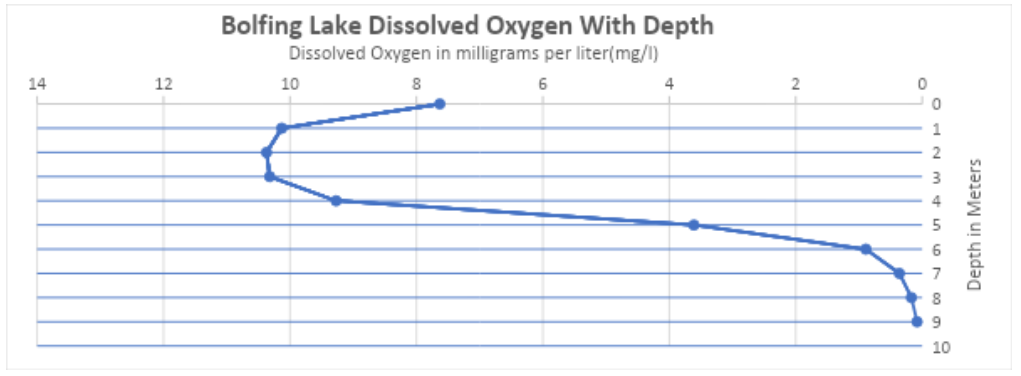
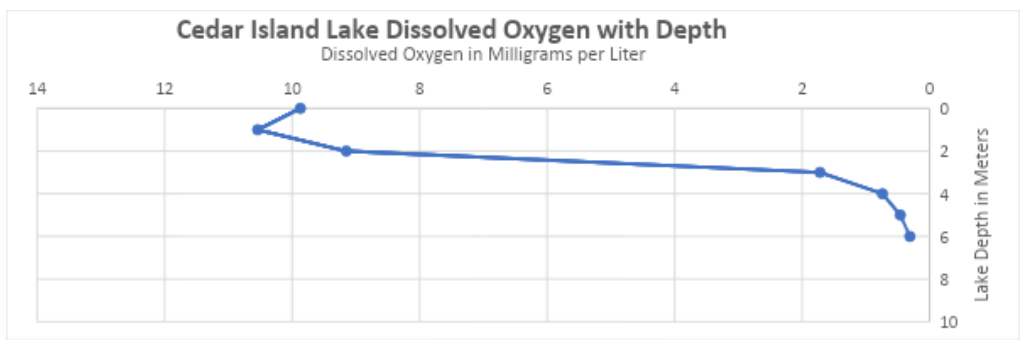
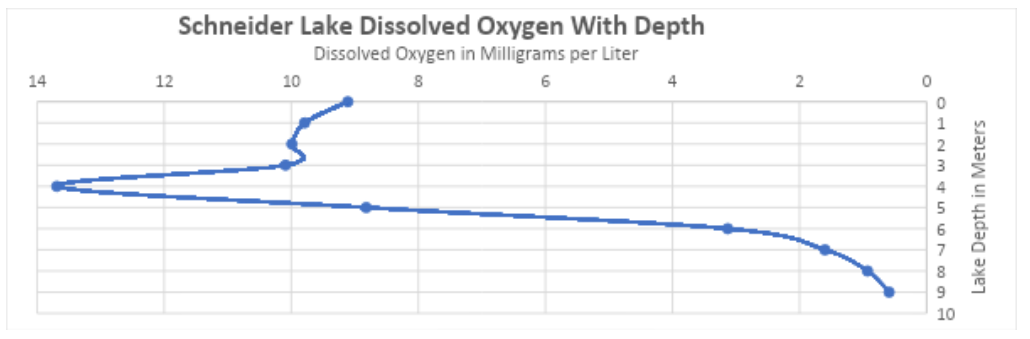
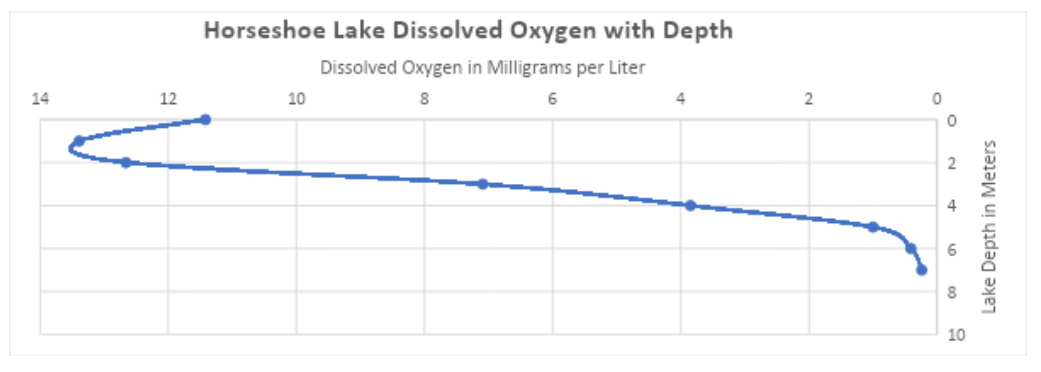
Below are graphs of the data collected on the four non-flowage lakes in July. Note that the dissolved oxygen levels begin to drop off significantly between the 3- and 4-meter levels. The exception is Schneider Lake which had a spike in the DO at the 4-meter level. We used two different probes to confirm the readings and they both measured the same amount of DO. We did not see this in our June data and at this time we have not come up with an explanation for the spike. At six meters (18 feet), there isn’t enough DO to support fish. Hypoxia(<2mg/l) was not reached at Krays or Knaus Lakes. Both sampling locations in these lakes are less than three meters deep and are in the main flowage of the Sauk River.
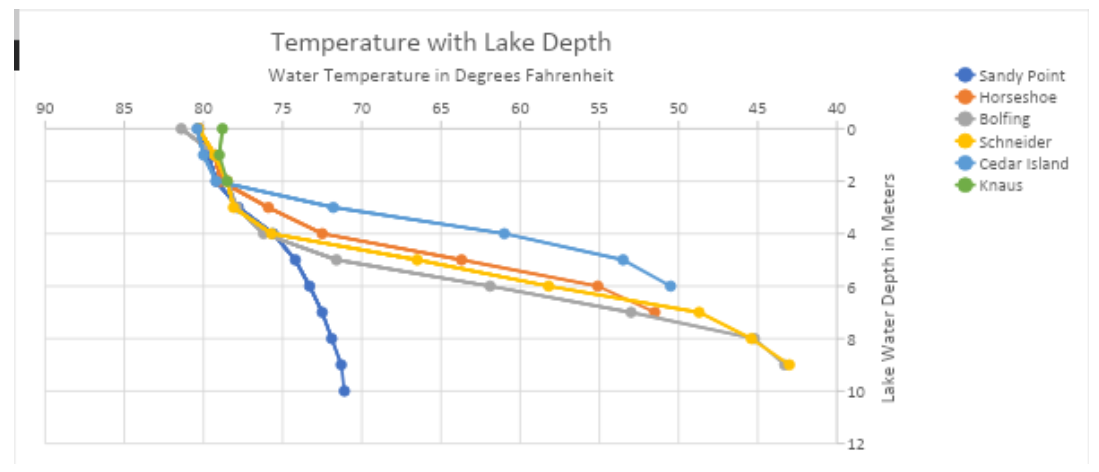
The temperature profile graph below also provides evidence of the significant temperature drop in the deeper non-flowage lakes. Surface water temperatures were around 80 degrees at all locations and dropped more than 30 degrees as you approached the lake bottom. Out of curiosity we decided to take readings at Sandy Point. It is the narrows between Great Northern and Krays Lakes and it is over 35 feet deep in this location. Note that there is not a significant temperature drop off (less than 10 degrees) even though it is the deepest location sampled. It appears that the flowage of the Sauk River at that location provides enough mixing to not allow for a big temperature drop at Sandy Point. However, if you look at the DO depth profile you will see that the DO drop is similar to other non-flowage lakes.
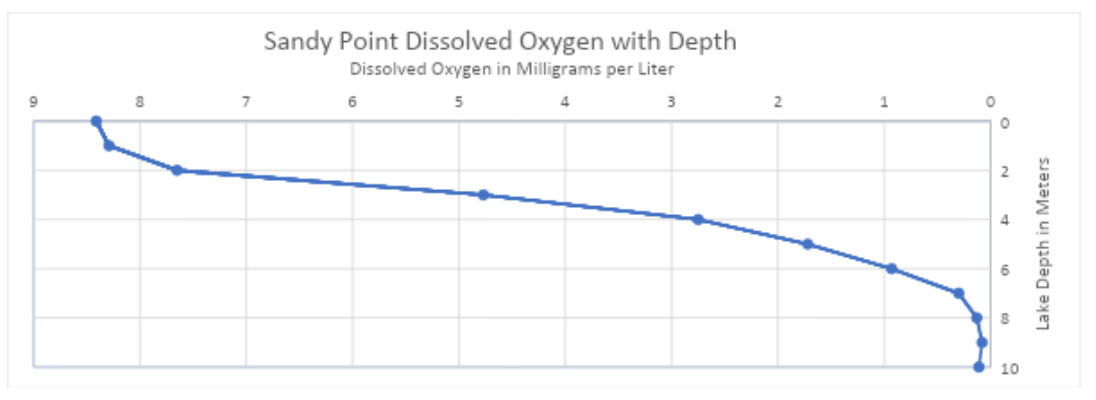
The oxygen drop off may be because the water deep-down is moving more slowly and sediment, detritus, and other organic material is still settling to channel bottom. So, there is a buildup that is still being eaten by bacteria. The process of bacteria breaking down organic matter is what depletes the oxygen, and it occurs faster at higher temperatures due to the nature of bacterial respiration and metabolism. It is also possible that the flow is confined to the upper layers with little flow near the bottom of the basin allowing organic matter to deplete the oxygen.
As of the due date for this article the August, September, and October samplings have not been completed. To get a better understanding of the lake dynamics in the chain, I would like to take DO and temperature readings at the deep holes in Schneider, Horseshoe, and Cedar Island lakes in August. I would also like to sample the deep holes in the flowage of Koetter and Zumwalde Lakes to see if they are like the Sandy Point profiles. Then in late October, I will take DO and temperature readings at these sites as the lakes are about to turnover. Then I would like to take readings in January through the ice. I hope to publish the results in the Spring 2024 SRCLA “The Chain Link” magazine.